An environmental footprint is one metric to understand the impact of current production practices. Diving deeper into what composes the footprint gives an operation the power to identify strategies to change the shape of the footprint in the future. Remember, though, that a footprint is only one metric, one number, one part, of all the considerations a farm should include in their environmental stewardship.
Simplistically, a carbon footprint represents, in units of carbon dioxide, the amount of greenhouse gases (GHG) generated during production.
Before taking a footprint at face value or comparing two footprint numbers, recognize that scope and unit of production dramatically affect a footprint result. The scope, or boundary, makes a big difference! The scope of the footprint outlines what part of the production cycle is included in the calculation.
For pigs, two common scopes are:
Cradle-to-farm gate: This includes GHG emissions generated during feed production, operating barns, and managing animals and manure to support a pig through its growth until the pig leaves the farm. The Pig Production Environmental Footprint Calculator (available at www.pork.org) uses producer-supplied information to calculate farm-specific carbon, water, and land footprints from cradle-to-farm gate.
Cradle-to-plate: This includes cradle-to-farm gate GHG emissions plus GHG emissions generated during pork processing, delivery to stores, and preparation by consumers. An example of cradle-to-plate footprints in action is the National Pork Board’s recent report showing carbon emissions per pound of pork produced declined 55% over the last 55 years.
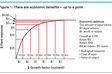
We recently worked with pig farmers in Minnesota, Nebraska, Iowa, and South Dakota to calculate carbon footprints for their farms using the Pig Production Environmental Footprint Calculator. When we used a common corn and soybean meal-based diet for all farms, the range of footprints for the wean-to-finish barns was 2.37 to 2.54 pounds carbon dioxide equivalent (CO2e) per pound of pig at the farm gate, and 1.60 to 2.50 pounds CO2e per pound of pig for grow-to-finish barns.
Wean-to-finish barns raise pigs from newly weaned (approximately 15 pounds) to market weight (approximately 285 pounds). Grow-to-finish barns raise pigs starting at 50 pounds to market weight.
All of the participating wean-to-finish and grow-to-finish farms in our study had deep pit storage of manure under the slatted floors of their barns. For these farms, the two main contributors to the cradle-to-farm gate footprints were feed production (48%) and manure management (49%). Feed production includes the energy consumed in the production of fertilizer and crop inputs, field activities, harvesting and processing of feed ingredients, as well as emissions from the soil system.
Energy use in this chain generally relies on fossil fuel use and releases greenhouse gases. Electricity, barn heat, and water distribution were generally less than 3% of the footprints.
The role of manure
The GHG emissions from manure are methane and nitrous oxide. Methane formed is from the anaerobic breakdown of manure organic material. Higher temperatures and a longer storage time raise the rate of methane generation.
There is an optimum amount of organic material — the volatile solids portion of the manure — for methane generation. Too little and there is not enough food for the anaerobic microbes. Too much and the microbes are overwhelmed.
Nitrous oxide production depends on the nitrogen content of the manure. The type of manure storage influences both methane and nitrous oxide emission. Because the manure storage system contributes almost half of the GHG in a cradle-to-farm gate carbon footprint, changing the storage method and removal frequency can significantly alter a farm’s carbon footprint.
We used an example grow-to-finish farm in Nebraska and the Pig Production Environmental Footprint Calculator to show how the carbon footprint changes when we simulate a farm with deep pit storage, lagoon storage, or an anaerobic digester (covered lagoon with electricity generation; Figure 1). A properly designed and managed lagoon system degrades and stabilizes organic matter, producing methane in the process.
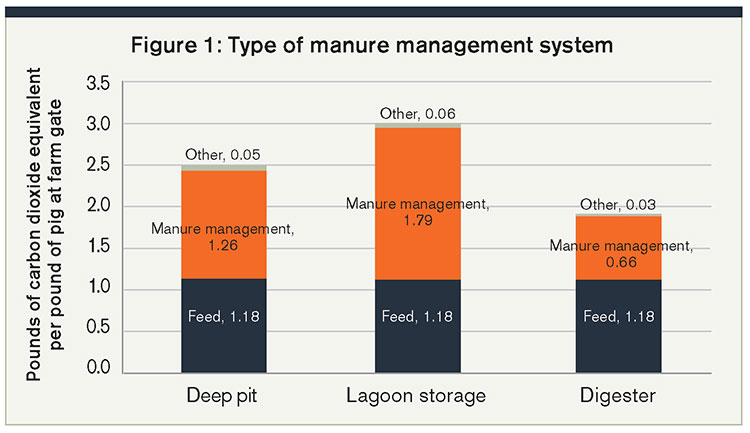
Nitrous oxide is a product of incomplete nitrification and occurs in anaerobic conditions. Methane is also produced by deep pit manure storages, but the anaerobic decomposition process is hampered by higher nutrient concentrations; thus, there are lower methane and nitrous oxide emissions. A digester promotes anaerobic stabilization of manure, but the methane is captured and a portion of the methane is converted to other forms.
While a change in manure storage design has carbon footprint implications, one must also consider local regulations, climate, cost, and both indoor and outdoor environments. There are advantages and disadvantages to all storage systems.
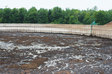
Earthen manure storages are not as common (and sometimes not allowed for pig farms) as deep-pit systems in Minnesota and other regions. Lagoon systems are more prevalent as you move south where warmer weather is more conducive to maintaining sufficient biological activity for manure treatment purposes.
Empty more often
Using the calculator, going from once per year to twice per year manure removal from a deep pit manure storage system on a typical grow-to-finish farm reduced the carbon footprint contribution of manure by 36% and the farm’s overall carbon footprint by 18%. Responsible manure management requires applying the manure nutrients when the crop can use them, but also lowering the risk of nutrient losses to the environment.
In Northern regions, fall application after harvest of crops, when cooler soil conditions reduce volatilization losses, is a best management practice to limit the risk of nutrient loss. Spring application of manure prior to planting situates the manure nutrients in place immediately before use by a growing crop. However, many farmers try to avoid spring application to minimize compaction of wet soils by heavy manure application equipment.
Carbon footprints are popular metrics in sustainability discussions, on and off the farm. Knowing the scope of a footprint and the major components that make it up lead to strategies to reduce the footprint value. However, the footprint needs to be part of a larger conversation about priorities and trade-offs in decision-making.
This article appeared in the May 2020 issue of Journal of Nutrient Management on pages 22 and 23.
Not a subscriber? Click to get the print magazine.