It is important to understand drainage tile flow trends in agricultural production systems to effectively manage tile-drained land. Tile flow is an indicator of elevated soil moisture content and water percolating through the soil profile. This excess water can transport essential plant nutrients, mainly nitrogen, out of the root zone. Once nutrients reach the drain tile, they can be transported to surface waters.
Considerations for tiled land
Drainage tile adds extra considerations when managing agricultural fields to maximize nutrient use efficiency and minimize the risk of nutrient loss to surface waters. Nutrient distribution must be carefully timed to minimize applications when tile flow is high and crop uptake is low. Proper timing of manure and fertilizer applications on tile-drained land will minimize nutrient loss.
Drainage tile flow trends can vary significantly between geographic regions or even fields on a farm based on several variables:
- Precipitation: timing, volume, and level of intensity
- Physical setting: slope, position in the watershed (headlands versus lowlands), and water table depth
- Soil properties: texture, restrictive layers, sand lenses, and textural changes from glacial deposits
- Land management: tillage type and crop rotation
- Drain tile: depth, spacing, type, and age of the tile system
Comparing the flow
Surface water run trends are similar in Wisconsin and Minnesota, with peak flow in March during snowmelt and in June with late spring rain on wet soils. The tile flow trends, however, are different between the two states (Figure 1).
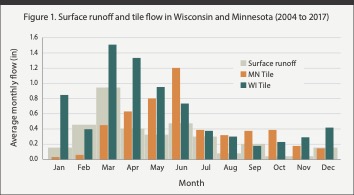
In Wisconsin, peak tile flow coincides with snowmelt in March, then steadily declines until September. Then it intensifies with late fall/early winter rain and snowmelt. In Minnesota, peak tile flows match the secondary surface runoff peak in June, rapidly falling in August and then climbing with snowmelt in March.
A multistate project
To gain more knowledge of tile flow patterns and nutrient loss dynamics in Wisconsin and Minnesota, Discovery Farms applied for and successfully received a USDA-NRCS Conservation Innovation Grant to evaluate 48 tile systems, evenly split between the two states. Tile flow and water quality data were collected for the project from October 1, 2017, to September 30, 2020.
A combination of intensive, intermediate, and basic tile monitoring strategies were used in four regions in each state to determine if lower cost monitoring methods could be combined with intensive monitoring to provide valuable information. At intensive tile monitoring sites, continuous flow data were collected and water samples were taken throughout flow events proportional to flow volume.
At intermediate tile sites, continuous flow data were collected and biweekly water samples were taken. For the basic sites, both an instantaneous flow measurement and water sample were collected biweekly.
In this new tile monitoring project, tile flow trends in Wisconsin and Minnesota were similar to those observed in previous tile monitoring. In Wisconsin, 23 out of 24 monitored sites were flowing greater than 50% of the time during biweekly site visits. Meanwhile, in Minnesota, eight out of 23 monitored sites were flowing greater than 50% of the biweekly site visits (Figure 2). Three of the sites in Wisconsin had continuous flow and many other near continuous, but Minnesota had no sites that were continuous.
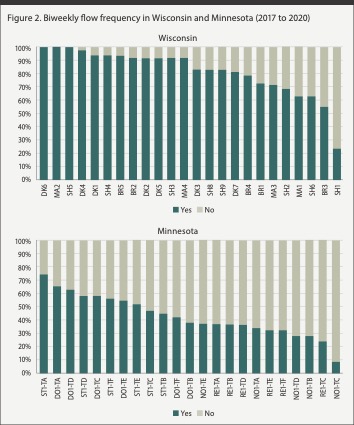
The differences in flow periods between Wisconsin and Minnesota are influenced by many of the previously stated variables, but in Wisconsin, many of the tile systems evaluated were likely intercepting groundwater or perched water tables. This is evidenced by both the continuous flow and flow volumes that exceed the actual precipitation volume for the surface topography defined basin for the tile system.
In addition, nutrient concentrations were extremely low and consistent as compared to sites with more intermittent flow. The upwelling groundwater into these tile systems likely diluted percolating water coming through the soil profile above the tile and made soil and nutrient concentration trend analysis in the tile difficult.
Evaluation of tile flow patterns
The flow information collected in this and previous Discovery Farms projects in Wisconsin and Minnesota help identify regional tile flow patterns. These patterns can be used to predict peak periods for tile flow when nutrients have the greatest potential to be leached from the crop root zone.
Fertilizer and manure applications should be timed to avoid these greater loss periods. Or, application could be combined with nutrient retention strategies like cover crops or controlled drainage to retain nutrients in the soil until they can be utilized by a subsequent crop. It is still important for farmers and consultants to evaluate tile systems they manage to determine individual flow patterns and yearly precipitation trends that can fluctuate annual flow trends in a tile system.
Additional analysis is being conducted to evaluate nutrient loss comparisons between cropping systems, tillage systems, manure and fertilizer timing, and cover crop retention. If you are interested in more information on nutrient retention practices such as cover crops, controlled drainage or other options, contact your local NRCS or Land Conservation Department representative.
This article appeared in the May 2021 issue of Journal of Nutrient Management on pages 6-7.
Not a subscriber? Click to get the print magazine.