The authors are a senior hydrogeologist and a hydrogeologist, respectively, for Dragun Corporation.
When a red light starts to flash on your vehicle’s dashboard, it usually means something is wrong with your vehicle . . . but not always. It could be a faulty sensor.
The same is true for monitoring nitrate in groundwater at the local field level. The nitrate concentrations in groundwater from a monitoring well may not be representative of the current farming practices on the property.
Recently, we have been asked to comment on monitoring data for nitrate in groundwater collected from a single monitoring well. We will share two examples that reflect the difficulties with interpreting this type of data.
Results from a single site
The first example started as a hypothetical: What do the nitrate concentration data from a single monitoring well in a field fertilized in part using manure from a larger dairy indicate? Our response began with the “brainstorming” sketch shown in Figure 1.
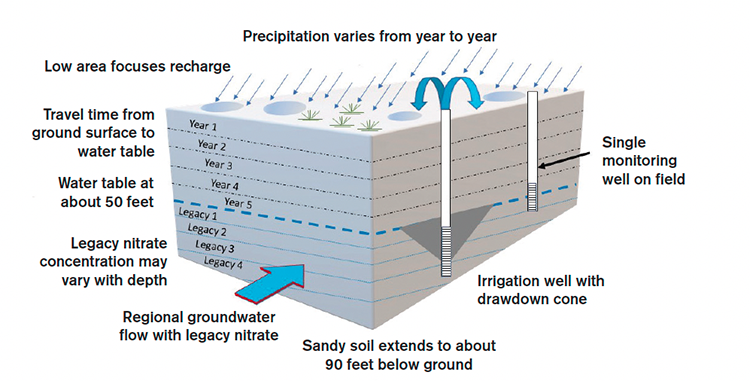
The monitoring well provides groundwater data from just below the water table, about 50 feet below ground level. The soil is all sandy and extends from ground surface to at least 90 feet below ground level. What do we need to consider with respect to the origin of the nitrate in the groundwater versus current agricultural practice?
Does “legacy nitrate” contribute to the groundwater under the field? Legacy nitrate is nitrate in the groundwater that originated from past agricultural practices somewhere upgradient from the single monitoring well. In a previous article (“Tracking down the nitrate source,” February 2020), we discussed how we can use “isotopes” in the nitrate ion to differentiate between a manure source and a chemical fertilizer source for the nitrate and isotopes in water molecules to estimate groundwater age.
The concentration and origin (manure or chemical) of the legacy nitrate can vary with depth below the water table. Which part(s) of the nitrate does the monitoring well sample?
How long does it take for nitrate to reach the water table under the field? This, in part, depends on how much precipitation occurs, which can vary from year to year. It also depends on the soil (types and spatial distribution) and the depth to the water table.
In our hypothetical example, it takes many years for the precipitation and nitrate from the current year to reach the water table. If farming practices change, when do the effects of the current farming practices show up in the water table?
Low areas in the field can focus recharge from precipitation and irrigation. How does this affect nitrate movement to the water table? Does the location of the single monitoring well result in groundwater nitrate data that are representative of the entire field?
If groundwater is used for irrigation, it can bring legacy nitrate to the surface. Irrigation wells can also homogenize the legacy nitrate in the groundwater to further complicate the issue. Does this affect the nitrate distribution in the groundwater?
The agricultural impacts
So, what does nitrate concentration data from one groundwater monitoring well tell us about the impacts of current agricultural practices? Thomas Harter from the University of California, Davis presented a webinar last fall where he discussed the areal variation in nitrate concentration in groundwater near the water table in a commercial almond grove in California’s Central Valley. The study site was a mile square, intensively instrumented (including 21 monitoring wells in a grid), and had detailed geological information.
Here is what was stunning about this study: Where the area was uniformly farmed, the areal variation in nitrate concentrations in groundwater included a difference of about 80 mg/L between two adjacent monitoring wells about 800 feet apart. Harter’s study site had significant spatial variation in subsurface soil types.
The second example is similar to the hypothetical site. The second problem involved the “background” monitoring well at an existing dairy. The site is underlain by sandy soil with the water table at about 20 feet below ground level. The regional groundwater has high concentrations of legacy nitrate, up to about 80 mg/L in some places.
The legacy nitrate originated from decades of chemical fertilizer use and heavy irrigation for crops. The dairy’s problem was that the nitrate concentration in groundwater at the “background” monitoring well was consistently less than 10 mg/L; that is, it was not representative of the (legacy) groundwater moving onto the dairy property. How could this happen?
We took two actions to find out. First, we installed data loggers in the “background” monitoring well and several other wells to record the elevation of the water table continuously for a period of months. This allowed us to determine the groundwater flow direction at the “background” well continuously. With this information, we could determine whether the regional groundwater, with its legacy nitrate load, was always flowing onto the dairy property or not.
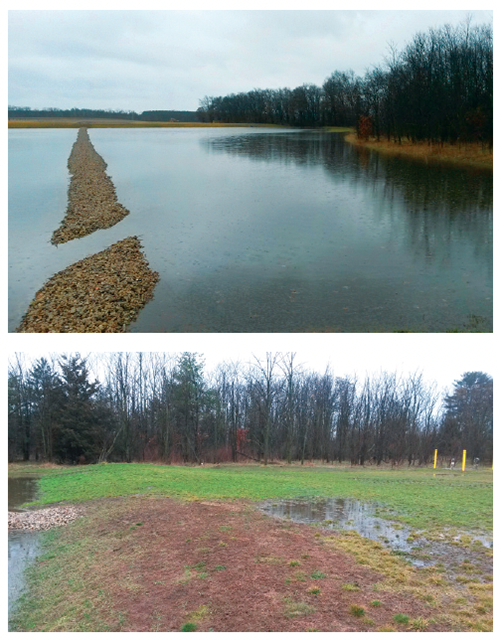
Second, we conducted a large scale, natural tracer test next to the “background” monitoring well to determine where the groundwater originated. A large, spring rainstorm caused ponding of the vegetative treatment area (VTA), which is used to treat part of the nonproduction area storm runoff. The photos show the flooded VTA and the “background” monitoring well.
Three main things happened. First, the data loggers indicated that the water table “mounded” from infiltration of the ponded water in the VTA, compared to areas further from the VTA. The mounding reversed the direction of groundwater flow at the “background” monitoring well; that is, the groundwater with the legacy nitrate episodically stopped moving onto the dairy property.
Second, the ponded water, which was virtually free of nitrate, diluted the nitrate concentration in the groundwater at the “background” well as it seeped into the ground and caused the mounding. This did not occur at monitoring wells further from the VTA.
Third, we were able to test the ponded water and the groundwater around the dairy for oxygen and hydrogen isotopes in the water molecules (see our February 2020 article). The ponded water and groundwater were very different isotopically, but the groundwater at the “background” monitoring well became like the ponded water isotopically.
In other words, when it rained heavily, nonproduction area runoff ponded in the VTA, creating preferential recharge to the groundwater. This caused localized groundwater mounding, blocking of the regional groundwater inflow with its legacy nitrate, and nitrate dilution in the groundwater around the “background” monitoring well.
Two other interesting observations were made. We installed monitoring wells further upgradient than the “background well,” beyond the mounding effect. Data from these upgradient monitoring wells confirmed that the regional groundwater with its legacy nitrate was still flowing toward the dairy (see the first consideration in the first example).
The downgradient monitoring wells at the dairy also had nitrate concentrations considerably lower than the legacy nitrate concentrations. It is possible that because the VTA is located in a naturally lower spot, this area has always acted as a preferential recharge area, long before the dairy was built (see the fourth consideration).
Ask more questions
Do you need to be alarmed by the “flashing light” of the high nitrate concentrations in groundwater observed at a single monitoring well? We suggest that you and the regulators exercise caution when using nitrate concentration data from single monitoring wells to make decisions about your farming practices.
Do the data make sense in the big picture? Are there special circumstances that may skew the nitrate data? Do you need to step back and look at a larger area to help interpret the local nitrate data? Can isotopes and high-resolution water level data help to explain what is going on with nitrate in the groundwater? Ask yourself these questions first.
This article appeared in the August 2021 issue of Journal of Nutrient Management on pages 10 and 11. Not a subscriber? Click to get the print magazine.