When it comes to on-farm nutrient planning, achieving a balance between crop needs and environmental losses is critical to ensuring productivity and sustainability. For six years, the UW-Madison Division of Extension Discovery Farms Program has been collaborating with Wisconsin farmers and producers to collect data about on-farm nitrogen use across the state through the Nitrogen Use Efficiency (NUE) project.
Complexities of the cycle
Nitrogen (N) has a complex cycle and takes on many forms. N is transformed and transported within the farm system through a variety of processes (Figure 1). The fate of N is highly affected by on-farm factors such as cropping system, management practices, soil type, and hydrology, as well as external factors such as weather conditions.
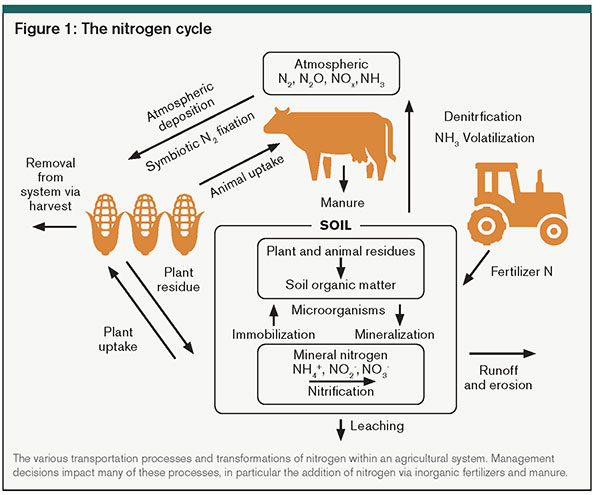
There are many pathways for N loss from a cropping system, including:
Volatilization — the loss of ammonia gas when manure and fertilizers are left on the soil surface.
Denitrification — the loss of N in the reduction of nitrate to gaseous forms during saturated soil conditions.
Leaching — the loss of nitrate by percolating water through the soil profile and into groundwater.
N may also be tied up in soil and plant organic matter left on the field after harvest. Harvested plant material removes N from the system entirely. A simple N budgeting approach may increase on-farm efficiencies while minimizing external losses.
Nutrient applications of inorganic fertilizers and/or manure are often necessary to maximize yield and improve profitability. Yet, inefficiencies exist in crop N utilization because of both inherent biological constraints of the growing plant as well as inevitable losses of applied N due to the many transformations and transport processes occurring at any given moment.
Any N in the system not actively being utilized by a growing crop has the potential for loss. It is this N that can be considered as potentially leachable N, meaning it may be lost to groundwater due to no active plant uptake.
Calculation of the amount of potentially leachable N requires information on additions of N as fertilizer and/or manure, and removals of N as the yield and N content of the harvested crop. Quantifying this inefficiency by determining crop utilization relative to nutrient additions can identify where management interventions may be beneficial.
Comparing the results
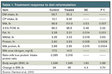
The first step of any budgeting approach is to define the system boundaries both spatially and temporally. The Discovery Farms NUE database collected data from over 300 fields and calculated the difference in N applied and N removed in the harvested plant material over single crop rotations.
Discovery Farms found farmers applied on average 180 pounds of N per acre to corn grain fields, with 80% of this N as inorganic fertilizer and the rest as manure, as well as some legume credits. Average yield was 222 bushels per acre at 1.05% N content, leading to an average of 130 pounds of N removed from the system through grain harvest.
Although there is variability across the different fields (top of Figure 2), the difference between average N additions and N removal is 49.7 pounds of N per acre per year. This difference is what can be considered as potentially leachable N.
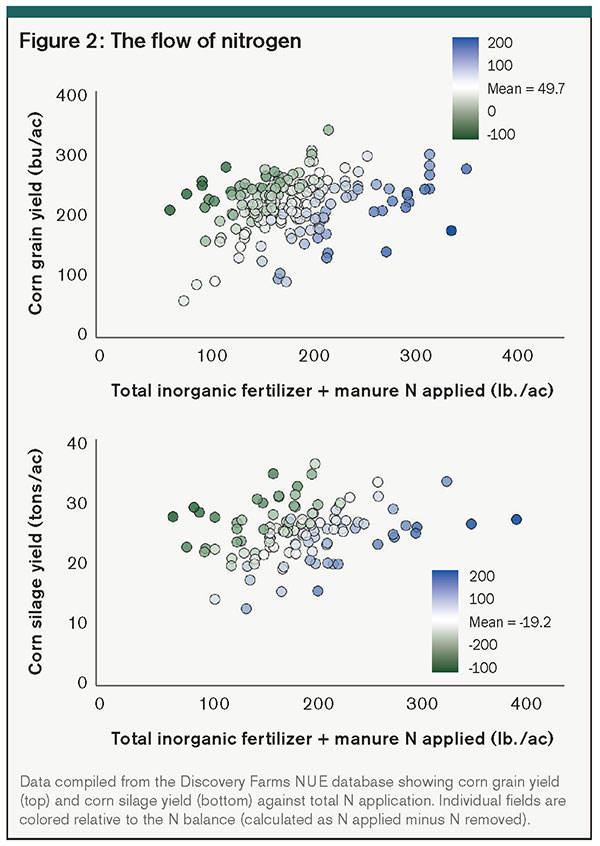
When no crop remains in the field, this “leftover” N may be lost from the system via the various pathways described earlier. This represents both an economic loss of potentially unused fertilizer, as well as an environmental concern when this N in the nitrate form moves downward past the root zone where it will eventually reach groundwater.
Now consider the silage data (bottom of Figure 2). Total average N inputs for silage were slightly higher than grain at 190 pounds of N per acre with significantly more of this N input as manure compared with grain fields. Average yield was around 25.8 tons per acre at 1.15% N content, leading to an average of 209 pounds of N removed from the system through silage harvest. The average difference between N additions and N removal is -19.2 pounds per acre per year.
Although the silage data was more limited and variable than the grain data, silage fields in Wisconsin, on average, have a negative N removal rate; this means silage harvest tends to remove more N from the field than is applied. A negative removal rate could signify a potential soil N mining situation, where crop needs are utilizing mineralized N provided from soil organic matter.
Given the higher rates of manure application in silage fields, this could potentially affect the N calculation since only the “available N” — or if no manure analysis is available, a “book value N” — in the manure is used. However, this should not be interpreted as silage having no potentially leachable N, as one-third of silage fields in the database have a positive balance.
Using nitrogen data
How can these metrics be utilized to understand both on-farm nutrient cycling and the implications for water quality? Excess N in the system during any given crop rotation has the potential to leach out of the root zone and into groundwater. Fields that are above average should consider management interventions to move the N balance down to prevent excessive losses of N to the environment. Excessive N loss affects both profitability and sustainability of the farming operation.
If a field is found to have a positive N balance, changes in management should be utilized to limit the loss of N. Some approaches to better N management may be to re-examine fertilizer management plans (the 4Rs), use of cover crops, or other alternative N sources such as legumes.
A recent joint analysis of tile drainage by Wisconsin Discovery Farms and Discovery Farms Minnesota found that a winter cover crop significantly reduced nitrate concentrations in tile drainage water over the winter and into early spring. Tracking the effectiveness of Iowa’s Nutrient Reduction Strategy in reducing N loss has shown the positive impacts of cover crops, grazing pastures, and incorporating more perennial cropping systems into agricultural land use practices.
While some of these practices that substantially reduce N losses may require higher up-front investments, simply calculating the potentially leachable N doesn’t take much time or effort. This can be an easy step toward better understanding the impact of the current cropping system and the potential of management interventions to reduce N losses. More details can be found in the Discovery Farms publication, “Nitrogen Use Efficiency: A Guide to Conducting Your Own Assessment.”
This article appeared in the November 2021 issue of Journal of Nutrient Management on pages 6 and 7.
Not a subscriber? Click to get the print magazine.